
- Home
- QR code analytics
QR code analytics: understand every scan
See how many people scan, when, where, and which code works best.
How many?
1,401 scans
1,083 unique
When?
8–9am
busiest hour, Saturdays busiest day
Where?
- Austin530
- San Antonio203
- Dallas182
Which code?
- Flyer, Main Street449
- Poster, mall entrance280
- Table tent156
Definition
What is QR code analytics?
In shortQR code analytics measures how people interact with your QR codes. Each scan of a dynamic QR code is recorded, so you can see scan volume, timing, approximate location and device, and judge how flyers, packaging, posters and menus perform.
Only dynamic QR codes can be measured. A dynamic code opens a short link we host, which counts the scan and sends the person on. A static code holds its destination directly and never passes through us, so there’s nothing to count. More in static vs dynamic QR codes.
At a glance
- Codes counted
- Dynamic codes only
- Reports
- Up to the last 12 months
- Plans
- Every paid plan
- Scanner IP addresses
- Not stored
- Cookies on scan pages
- None
- Bots and link previews
- Left out of counts
Scan counts
How many times was my QR code scanned?
Total scans count every time a code is opened, including repeat scans. Unique scans count each phone once per code per day. It’s an estimate, not a head count.
| What happens | Total | Unique |
|---|---|---|
| Scans 3 times on Monday | 3 | 1 |
| Scans again on Tuesday | 1 | 1 |
| Report for both days | 4 | 2 |
The report also shows the average per day and hour, growth against the period before, and how many link previews and bots were left out.
Timing
When are people scanning it?
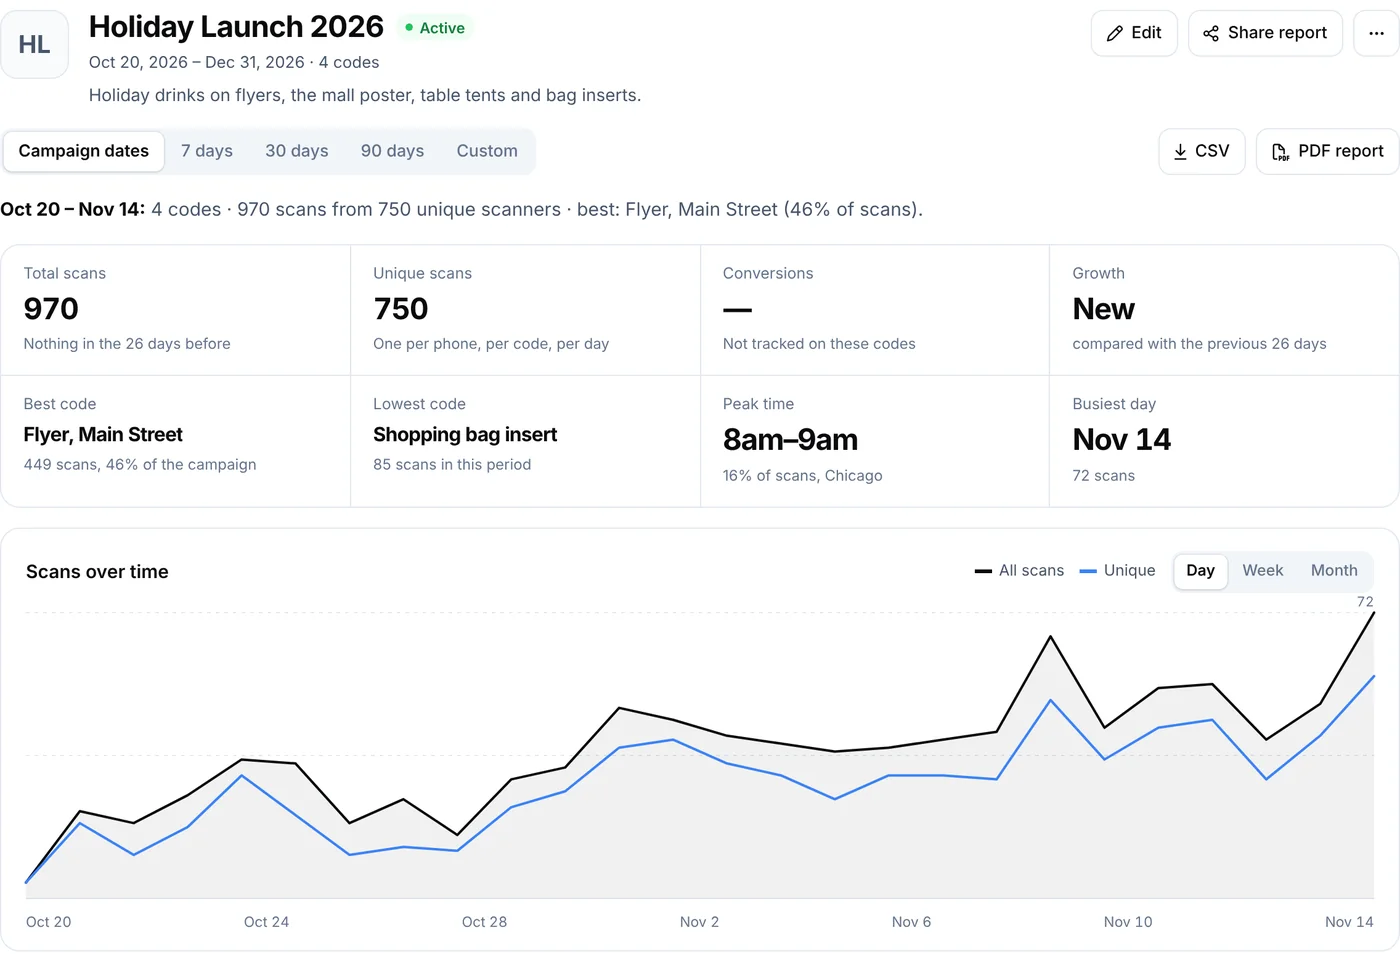
Scans over time shows the trend by day, week or month for the last 7, 30 or 90 days, 12 months or any custom range, so you can see whether a new poster lifted scans or a promotion faded. Time of day and day of the week show when people scan, in your own time zone. A café might find its menu code peaks at 8am and on Saturdays, and staff accordingly.
Busiest 8am–9am, 17% of scans.
Most scans on Saturdays (21%).
Location
Where are the scans coming from?
See scans by country, region and city. A business with flyers in several cities can see which ones get scanned. Location comes from the phone’s internet connection, not GPS: the country is reliable, but region and city are approximate, and mobile networks and VPNs can show a nearby place.
Location comes from the network the phone used, not GPS. It’s usually right for the country, roughly right for the city, and mobile networks can place people in a nearby city.
On what device?
Totals by device type, operating system and browser, including in-app browsers such as Instagram’s. If most scans come from iPhones in Instagram’s browser, test your landing page there first.
Comparison
Which QR code or placement performs best?
- One code per placementFlyers, posters and table tents each get their own code, even when they open the same link. Bulk QR codes make them in one go.
- Compare them in the code tableEach code’s trend, scans, change, unique scans and all-time total. Sort by most or least scanned or biggest change, put several codes on one chart, or filter the page by code or campaign.
- Report on the whole print runGroup the codes into a campaign: totals, a per-code comparison and a read-only link for a client.
- 1Flyer, Main StreetBest44946%
- 2Poster, mall entrance28029%
- 3Table tent15616%
- 4Shopping bag insert859%
How it works
How to track QR code scans
Create a dynamic code
In the generator, pick Dynamic.
Download and print it
On your flyer, menu or package.
People scan it
With their phone camera. No app needed.
Open Analytics
Each scan is counted as the person is sent on.
Compare codes and campaigns
See which placement works best.
Compared
QR code analytics vs Google Analytics
| Compared | QR Code Planet analytics | Google Analytics |
|---|---|---|
| Measures | Scans of your QR codes | Visits to your website |
| Counts | Total and unique scans, time, approximate location, device | Sessions, page engagement, events, conversions you set up |
| Works when | The code is dynamic, whatever it opens | Its tag is on the destination website |
A scan isn’t a website visit or a sale: someone can scan and close the page. To see scan traffic in Google Analytics, turn on UTM tags for a code, or set them once for a campaign; visits then arrive labeled with your source, medium and campaign. Nothing is sent to Google automatically. How QR code tracking works explains what happens during a scan.
Go beyond scans with conversion tracking (Pro)
A scan tells you someone opened the code. A conversion tells you they then did something on your site, like buying or signing up. To count it, your site reports the event with a small script or a server call, using the id added to the link of a tracked scan. Conversions then show next to scans in the report. We never assume a conversion from a scan.
?qcp= id in the link.3. Add this to your website, then report events<script src="https://qrcodeplanet.com/t.js" defer></script><script> // When the action happens on your site: qcp('purchase_completed', { value: 49.99 });</script>
/api/v1/conversions with your API key.Privacy
Useful scan insights without building personal profiles
Scan analytics are totals. Each scan adds one to counters for its hour, place and device; nothing in the report points to a person.
Recorded with each scan
- The hour and day
- Country, region and city, from the network
- Device type, operating system and browser
Not kept
- The scanner’s IP address
- Cookies: scan pages don’t set any
- Profiles of the people who scan
To estimate unique scans, we make a one-way fingerprint from the network address and browser, mixed with a key that changes every day. Fingerprints and keys are deleted after two days, so one person’s scans can’t be linked across days, by you or by us. Read the privacy policy for details. You’re responsible for how your own landing pages handle visitors’ data.
Limits
Limits and accuracy
- Only dynamic codes are counted. Static codes never reach our servers.
- Location is approximate. It comes from the phone’s network, so a city can be the mobile operator’s nearest hub.
- A scan is counted when the code is opened, not when the person finishes reading the page.
- Unique scans are estimates. Phones sharing a network and browser (office or event Wi-Fi) can count as one; a phone that changes network can count twice.
- Link previews, crawlers and prefetches are left out. A script pretending to be a phone can still be counted.
- Reports cover the last 12 months.
Use cases
Who uses QR code analytics
- Restaurants and cafesSee when the menu code is busiest and how lunch compares with dinner.
- Retail and packagingCompare scans across products, packages and in-store signs.
- Marketing agenciesCompare each client’s codes and campaigns, and share a read-only campaign report.
- Events and exhibitionsSee which poster, booth sign or banner people scanned, and when.
- Real estateCompare yard signs, brochures and flyers for each listing.
- Multi-location businessesOne code per branch, compared side by side, with the cities they’re scanned in.
Plans
What each plan includes
| Feature | Free | Lite | Pro | Agency |
|---|---|---|---|---|
| Dynamic codes (needed for analytics) | 3 | 25 | 250 | 2,000 |
| Scans, unique scans, time, location, devices | Not included | Included | Included | Included |
| Date ranges up to 12 months, code comparison | Not included | Included | Included | Included |
| PDF report | Not included | Included | Included | Included |
| Campaign reports and CSV | Not included | Included | Included | Included |
| CSV export of the Analytics page | Not included | Not included | Included | Included |
| Conversion tracking | Not included | Not included | Included | Included |
A free account includes 3 dynamic codes, but scan stats come with a paid plan. Static codes work forever but can’t be counted. See prices
FAQ
Questions people ask
Can’t find yours? A person answers every email within 2 working days.
Email usWhat is QR code analytics?
Counting and describing the scans of a QR code: how many, when, from where and on what device, so you can judge how a printed placement performs.
Can I track how many times my QR code is scanned?
Yes, if it’s a dynamic code. Every scan is counted in the total, including repeat scans by the same person.
What’s the difference between total and unique scans?
Total counts every scan. Unique counts each phone once per code per day, so one person scanning three times on Monday is 3 total and 1 unique.
Can I track the location of QR code scans?
You see the country, region and city of the scans, worked out from the phone’s internet connection. Country is reliable; region and city are approximate. There’s no GPS location and no individual locations.
Can I see which device scanned my QR code?
You see totals by device type (phone, tablet, computer), operating system and browser, including in-app browsers like Instagram’s. Not individual devices.
Can I compare multiple QR codes?
Yes. The code table ranks your codes by scans, change or unique scans, and you can put several codes on the same chart. Campaigns group codes into one report.
Can I track static QR codes?
No. A static code holds its destination directly and never passes through our servers, so there’s nothing to count.
Can I track QR code scans with Google Analytics?
Google Analytics sees the visits to your website, not the scans. Turn on UTM tags on a code or a campaign and those visits arrive labeled with the source and campaign you choose.
Can I track conversions after a scan?
On Pro. Your website reports the sign-up or sale with a small script or a server call, and the report shows conversions next to scans. We never guess conversions from scans.
Can I export QR code analytics?
Every plan with analytics can save the report as a PDF. CSV export of the Analytics page is on Pro and Agency; campaign reports can be downloaded as CSV on every paid plan.
Can I identify the people who scanned my QR code?
No. You see totals by time, place and device, never individual people.
Does QR Code Planet store scanner IP addresses?
No. The address is used for a moment to estimate unique scans through a one-way fingerprint that changes daily and is deleted after two days. The address itself isn’t stored with the scan.
Start measuring your QR code performance
Create a dynamic QR code, print it anywhere, and see how people use it.
Keep reading